
To measure and calculate Cumulative Layout Shift (CLS) scores accurately, you need to understand that CLS quantifies the visual stability of a webpage by measuring unexpected layout shifts during page load or user interaction.
How CLS is Calculated
-
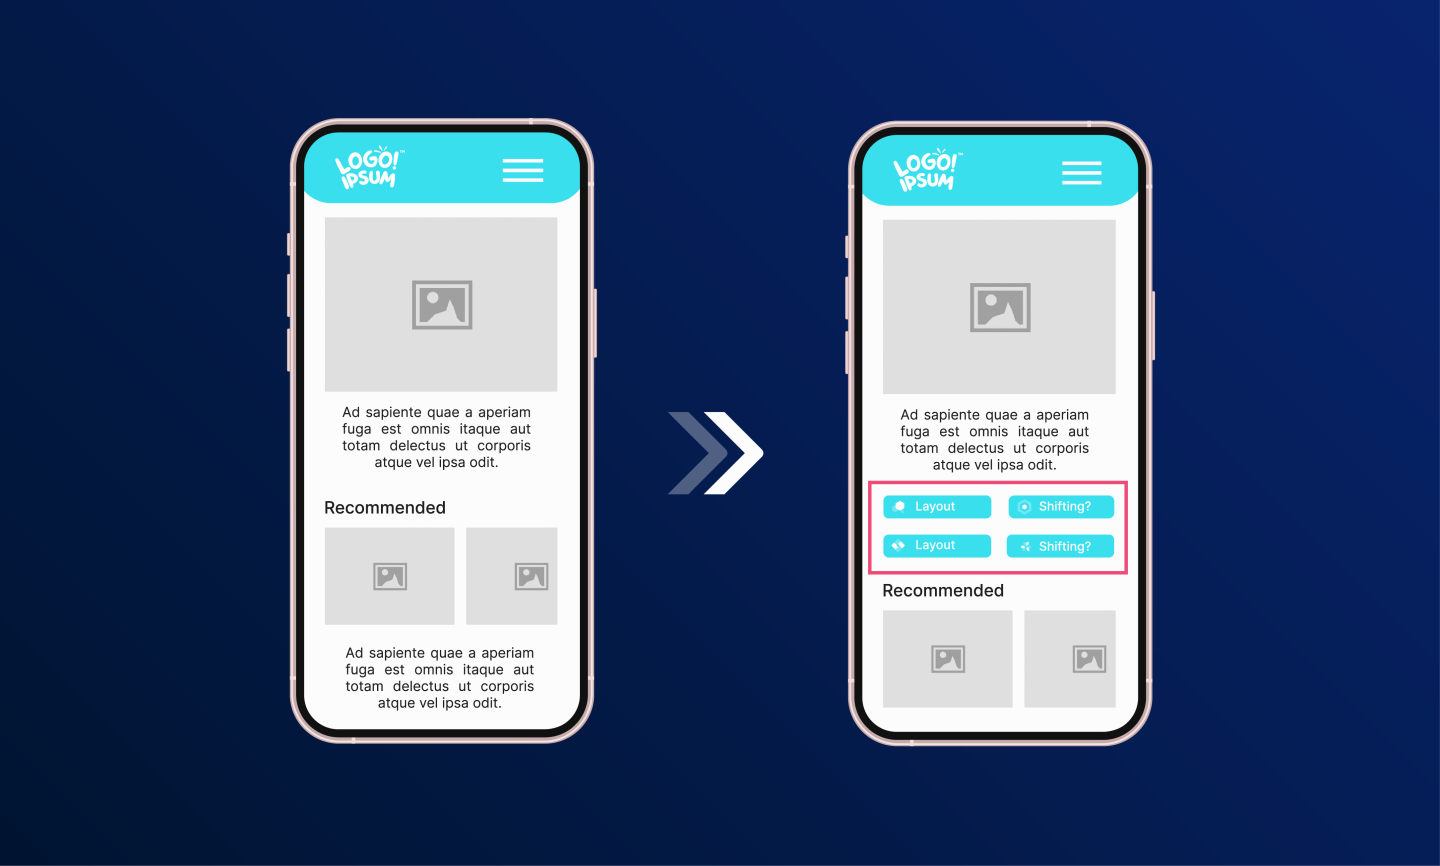
Identify Layout Shifts: A layout shift occurs when a visible element changes its position between two rendered frames without user interaction.
-
Session Window: CLS is calculated within session windows triggered by layout shifts. A session window lasts until 1 second passes without a new layout shift or a maximum of 5 seconds.
-
Calculate Layout Shift Score for Each Shift:
- Impact Fraction: Measures how much space the unstable element occupies in the viewport. It is the ratio of the impact region area (the union of all shifting elements) to the total viewport area.
- Distance Fraction: Measures how far the element moves relative to the viewport's largest dimension (width or height).
-
Formula:
[ \text{Layout Shift Score} = \text{Impact Fraction} \times \text{Distance Fraction} ] -
Final CLS Score: The CLS score for the page is the sum of all layout shift scores within the session window with the highest total score.
Example Calculation
- If an element occupies 60% of the viewport and shifts by 30% of the viewport height:
- Impact Fraction = 0.9 (90% of viewport area affected)
- Distance Fraction = 0.3 (30% of viewport height moved)
- CLS score = 0.9 × 0.3 = 0.27
Measuring CLS in Practice
- Lab Data: Use tools like Chrome DevTools or Lighthouse to measure CLS during initial page load in a controlled environment.
- Field Data: Use real user monitoring tools such as Google PageSpeed Insights, Chrome User Experience Report (CrUX), BigQuery, or Looker Studio to capture CLS as experienced by actual users, including shifts caused by scrolling or interaction.
Tools for Accurate Measurement
- Chrome DevTools & Lighthouse: Provide immediate CLS scores but only for lab conditions.
- PageSpeed Insights: Offers CLS scores for both mobile and desktop from real user data.
- Third-party Monitoring Tools: Provide continuous CLS monitoring and alerts for layout shift issues.
Important Notes
- CLS can differ between lab and field data because lab tests only capture shifts during initial load, while field data includes shifts during user interaction.
- Monitoring CLS over time and across different devices and screen sizes helps identify and fix layout instability effectively.
By following this method—calculating impact and distance fractions for each layout shift within session windows and summing the highest window score—you can measure and calculate CLS scores accurately to improve your website’s visual stability and user experience.


Ang PH Ranking ay nag-aalok ng pinakamataas na kalidad ng mga serbisyo sa website traffic sa Pilipinas. Nagbibigay kami ng iba’t ibang uri ng serbisyo sa trapiko para sa aming mga kliyente, kabilang ang website traffic, desktop traffic, mobile traffic, Google traffic, search traffic, eCommerce traffic, YouTube traffic, at TikTok traffic. Ang aming website ay may 100% kasiyahan ng customer, kaya maaari kang bumili ng malaking dami ng SEO traffic online nang may kumpiyansa. Sa halagang 720 PHP bawat buwan, maaari mong agad pataasin ang trapiko sa website, pagandahin ang SEO performance, at pataasin ang iyong mga benta!
Nahihirapan bang pumili ng traffic package? Makipag-ugnayan sa amin, at tutulungan ka ng aming staff.
Libreng Konsultasyon