
To create custom reports and dashboards in Google Analytics (GA4) for startups, you need to focus on tailoring the data visualization and metrics to your specific business goals, enabling actionable insights from your website or app data.
Creating Custom Dashboards in GA4
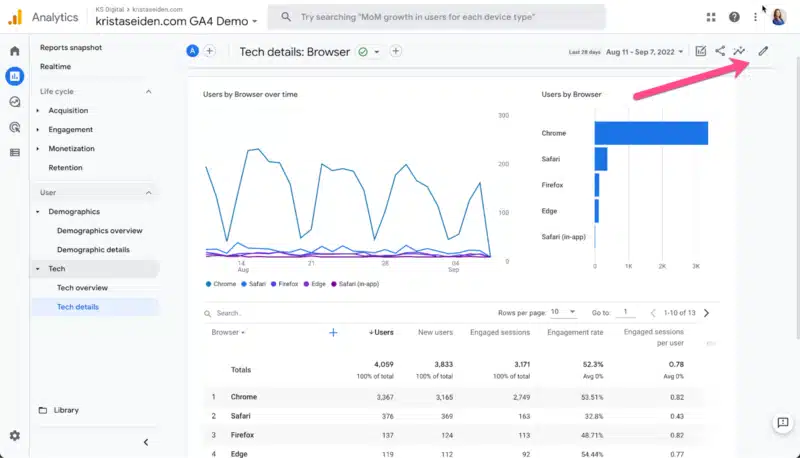
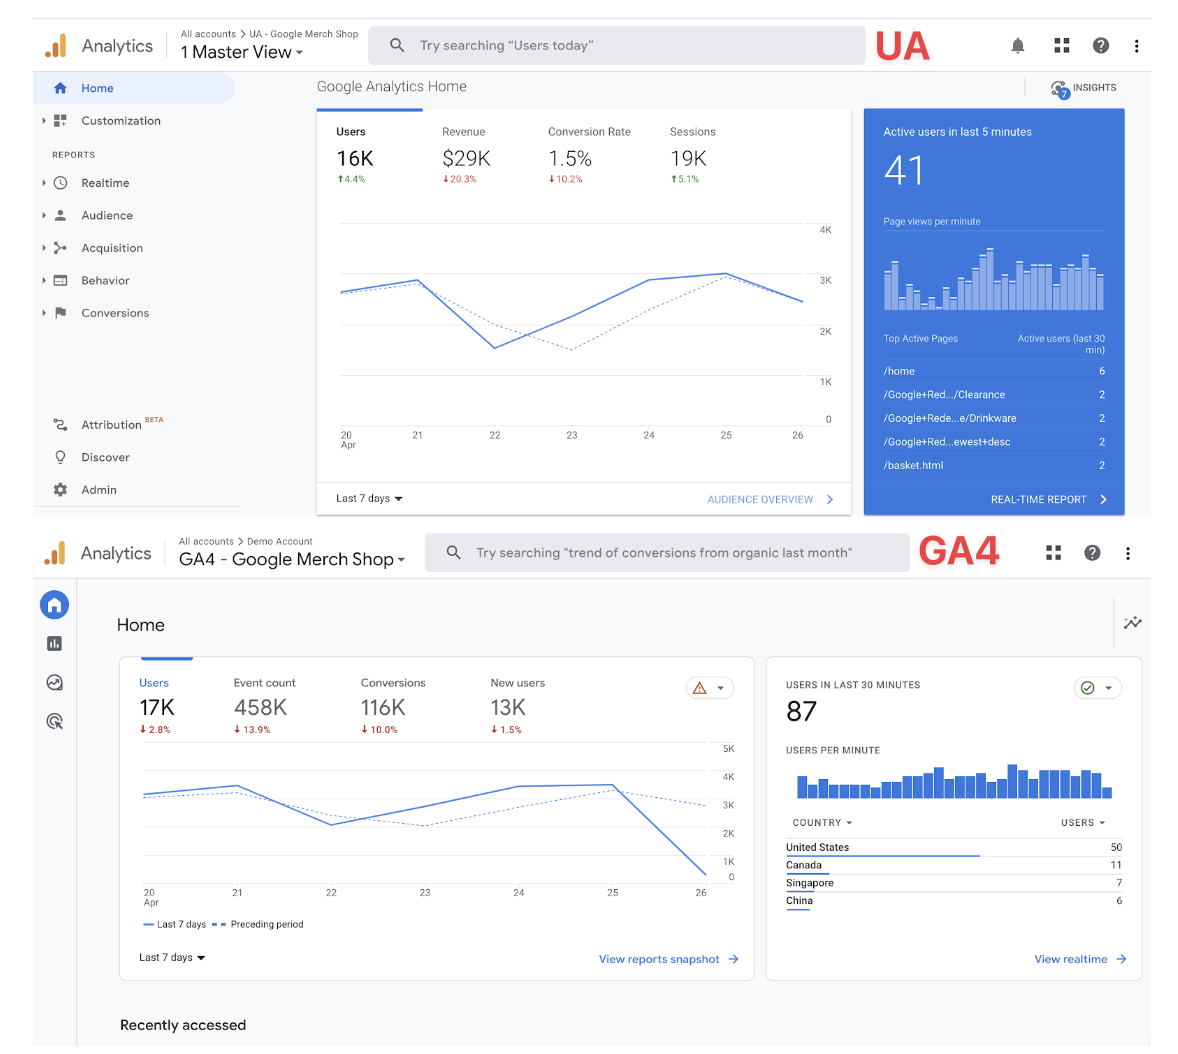
- Access Your GA4 Property: Log into Google Analytics and select your GA4 property.
- Navigate to Reports: Click on the ‘Reports’ section in the left menu.
- Create a New Dashboard: Scroll down to ‘Library’ at the bottom of the Reports menu, then select ‘Create New Report’ and choose ‘Create Overview Report’ to start a dashboard-style report.
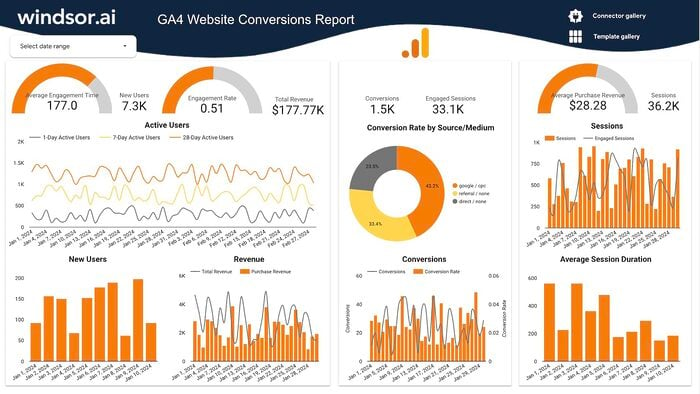
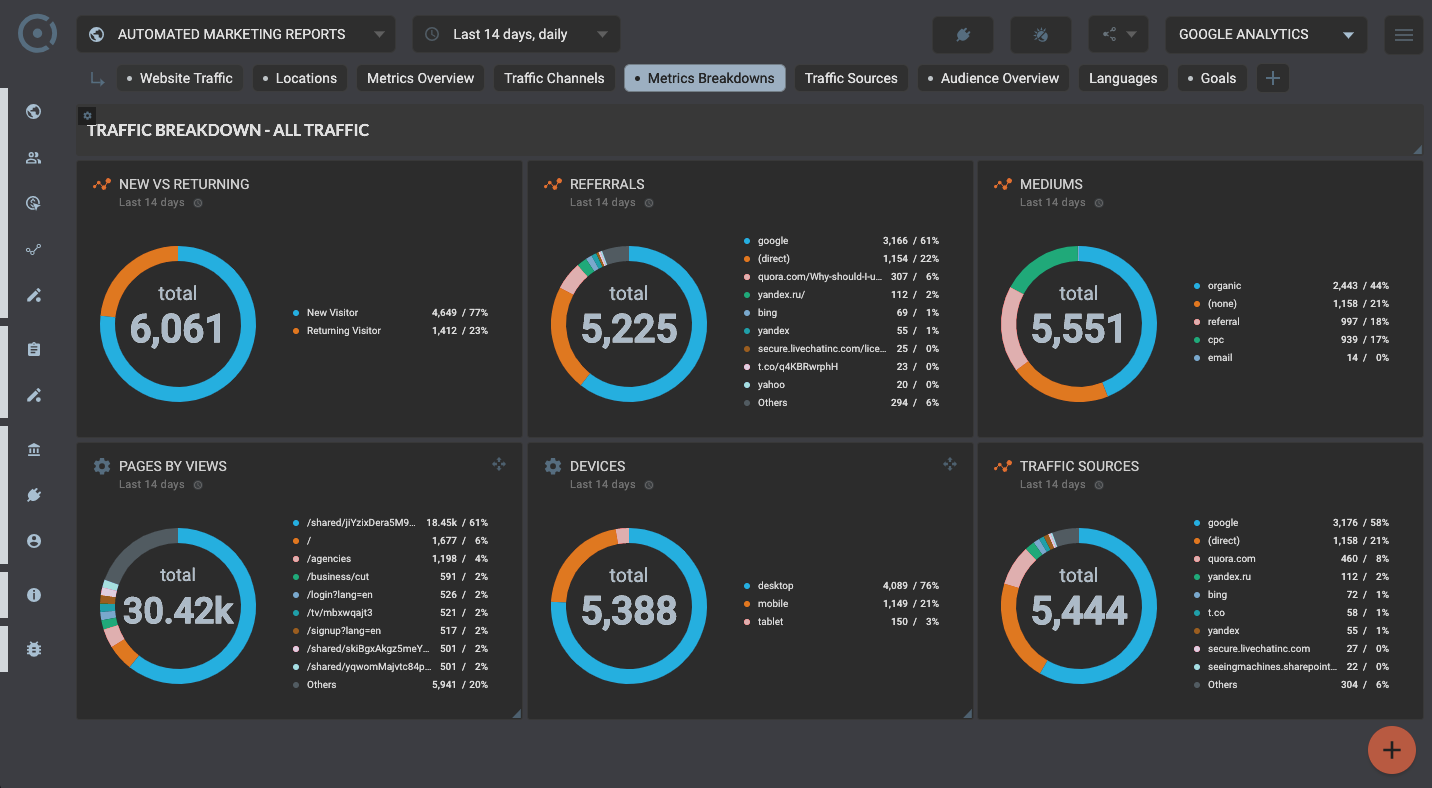
- Add Cards: Customize your dashboard by adding up to 16 cards, each showing different metrics like user acquisition, engagement, monetization, or retention. Cards can display various chart types such as tables, bar charts, donut charts, or maps.
- Reorder Cards: Use drag-and-drop in the ‘Customize Report’ panel to arrange cards for optimal viewing.
Creating Custom Reports in GA4
- Define Your Business Questions: Before building reports, clarify what questions you want to answer and which metrics will provide those answers.
- Access the Exploration Tab: In GA4, go to the ‘Exploration’ tab on the left menu.
- Choose Report Type: Use the ‘Free-form Exploration’ for flexible, drag-and-drop report creation. Other types include Funnel Exploration, Path Exploration, Segment Overlap, and User Explorer for specific analysis needs.
- Build Your Report: Drag and drop relevant dimensions and metrics to create detailed, tailored reports that reflect your startup’s key performance indicators.
- Save and Share: Save your custom reports for ongoing use and share them with your team as needed.
Additional Tips for Startups
- Focus on Key Metrics: Startups should prioritize metrics that reflect user acquisition, engagement, conversion, and retention to measure growth effectively.
- Iterate and Refine: Regularly update dashboards and reports as your business questions evolve.
- Use Pre-built Templates: GA4 offers templates and pre-configured cards to speed up setup.
- Permissions: Ensure you have editor or administrator access to create and customize reports and dashboards.
Limitations to Consider
- GA4 dashboards may not provide very deep or granular insights without custom setup.
- The interface can be complex initially, requiring some learning.
- Exporting data to other platforms may require additional tools since GA4 has limited native connectors.
This approach helps startups transform raw analytics data into actionable insights through customized visualizations and reports tailored to their unique business needs.


Ang PH Ranking ay nag-aalok ng pinakamataas na kalidad ng mga serbisyo sa website traffic sa Pilipinas. Nagbibigay kami ng iba’t ibang uri ng serbisyo sa trapiko para sa aming mga kliyente, kabilang ang website traffic, desktop traffic, mobile traffic, Google traffic, search traffic, eCommerce traffic, YouTube traffic, at TikTok traffic. Ang aming website ay may 100% kasiyahan ng customer, kaya maaari kang bumili ng malaking dami ng SEO traffic online nang may kumpiyansa. Sa halagang 720 PHP bawat buwan, maaari mong agad pataasin ang trapiko sa website, pagandahin ang SEO performance, at pataasin ang iyong mga benta!
Nahihirapan bang pumili ng traffic package? Makipag-ugnayan sa amin, at tutulungan ka ng aming staff.
Libreng Konsultasyon